🔥알림🔥
① 테디노트 유튜브 -
구경하러 가기!
② LangChain 한국어 튜토리얼
바로가기 👀
③ 랭체인 노트 무료 전자책(wikidocs)
바로가기 🙌
④ RAG 비법노트 LangChain 강의오픈
바로가기 🙌
⑤ 서울대 PyTorch 딥러닝 강의
바로가기 🙌
경사하강법 (Gradient Descent) 직접 구현하기
이번에는 머신러닝 뿐만아니라, 인공신경망 모델의 가장 기초가 되는 경사하강법 (Gradient Descent)에 대하여 알아보도록 하겠습니다. 경사하강법을 Python으로 직접 구현해보는 튜토리얼 입니다. 자세한 설명은 유튜브 영상을 참고해 보셔도 좋습니다.
코드
경사하강법 (Gradient Descent)
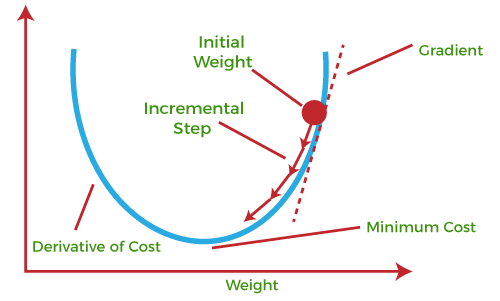
기본 개념은 함수의 기울기(경사)를 구하여 기울기가 낮은 쪽으로 계속 이동시켜서 극값에 이를 때까지 반복시키는 것 입니다.
비용 함수 (Cost Function 혹은 Loss Function)를 최소화하기 위해 반복해서 파라미터를 업데이트 해 나가는 방식입니다.
from IPython.display import YouTubeVideo, Image
import numpy as np
import matplotlib.pyplot as plt
경사 하강법을 수학으로 쉽게 이해하기
YouTubeVideo('GEdLNvPIbiM')
경사 하강법을 활용한 파이썬 코드 구현
YouTubeVideo('KgH3ZWmMxLE')
샘플에 활용할 데이터 셋 만들기
def make_linear(w=0.5, b=0.8, size=50, noise=1.0):
    x = np.random.rand(size)
    y = w * x + b
    noise = np.random.uniform(-abs(noise), abs(noise), size=y.shape)
    yy = y + noise
    plt.figure(figsize=(10, 7))
    plt.plot(x, y, color='r', label=f'y = {w}*x + {b}')
    plt.scatter(x, yy, label='data')
    plt.legend(fontsize=20)
    plt.show()
    print(f'w: {w}, b: {b}')
    return x, yy
x, y = make_linear(w=0.3, b=0.5, size=100, noise=0.01)
# 임의로 2개의 outlier를 추가해 보도록 하겠습니다.
y[5] = 0.75
y[10] = 0.75

plt.figure(figsize=(10, 7))
plt.scatter(x, y)
plt.show()
초기값 (Initializer)과 y_hat (예측, prediction) 함수 정의
w, b 값에 대하여 random한 초기 값을 설정해 줍니다.
w = np.random.uniform(low=-1.0, high=1.0)
b = np.random.uniform(low=-1.0, high=1.0)
y_hat은 prediction은 값 입니다. 즉, 가설함수에서 실제 값 (y)를 뺀 함수를 정의합니다.
y_hat = w * x + b
오차(Error) 정의
Loss Function 혹은 Cost Function을 정의 합니다.
Loss (Cost) Function은 예측값인 y_hat과 y의 차이에 제곱으로 정의합니다.
제곱은 오차에 대한 음수 값을 허용하지 않으며, 이는 Mean Squared Error(MSE)인 평균 제곱 오차 평가 지표와 관련 있습니다.
error = (y_hat - y) ** 2
학습률 (Learning Rate)
Image(url='https://www.deeplearningwizard.com/deep_learning/boosting_models_pytorch/images/lr1.png')
한 번 학습할 때 얼마만큼 가중치(weight)를 업데이트 해야 하는지 학습 양을 의미합니다.
너무 큰 학습률 (Learning Rate)은 가중치 갱신이 크게 되어 자칫 Error가 수렴하지 못하고 발산할 수 있으며,
너무 작은 학습률은 가중치 갱신이 작게 되어 가중치 갱신이 충분히 되지 않고, 학습이 끝나 버릴 수 있습니다. 즉 과소 적합되어 있는 상태로 남아 있을 수 있습니다.
Gradient Descent 구현 (단항식)
# 최대 반복 횟수
num_epoch = 5000

# 학습율 (learning_rate)
learning_rate = 0.5
errors = []
# random 한 값으로 w, b를 초기화 합니다.
w = np.random.uniform(low=-1.0, high=1.0)
b = np.random.uniform(low=-1.0, high=1.0)

for epoch in range(num_epoch):
    y_hat = x * w + b

    error = ((y_hat - y)**2).mean()
    if error < 0.0005:
        break

    w = w - learning_rate * ((y_hat - y) * x).mean()
    b = b - learning_rate * (y_hat - y).mean()

    errors.append(error)

    if epoch % 5 == 0:
        print("{0:2} w = {1:.5f}, b = {2:.5f} error = {3:.5f}".format(epoch, w, b, error))

print("----" * 15)
print("{0:2} w = {1:.1f}, b = {2:.1f} error = {3:.5f}".format(epoch, w, b, error))
시각화
학습 진행(epoch)에 따른 오차를 시각화 합니다.
plt.figure(figsize=(10, 7))
plt.plot(errors)
plt.xlabel('Epochs')
plt.ylabel('Error')
plt.show()
다항식
샘플 데이터를 생성합니다.
이번에는 Feature Data, 즉 X 값이 여러 개인 다항식의 경우에 대해서도 구해보도록 하겠습니다.
다항식에서는 X의 갯수 만큼, W 갯수도 늘어날 것입니다.
다만, bias (b)의 계수는 1개인 점에 유의해 주세요.
x1 = np.random.rand(100)
x2 = np.random.rand(100)
x3 = np.random.rand(100)
w1 = np.random.uniform(low=-1.0, high=1.0)
w2 = np.random.uniform(low=-1.0, high=1.0)
w3 = np.random.uniform(low=-1.0, high=1.0)

b = np.random.uniform(low=-1.0, high=1.0)
다항식을 정의합니다.
y = 0.3 * x1 + 0.5 * x2 + 0.7 * x3 + b
Gradient Descent 구현 (다항식)
errors = []
w1_grad = []
w2_grad = []
w3_grad = []

num_epoch=5000
learning_rate=0.5

w1 = np.random.uniform(low=-1.0, high=1.0)
w2 = np.random.uniform(low=-1.0, high=1.0)
w3 = np.random.uniform(low=-1.0, high=1.0)

b1 = np.random.uniform(low=-1.0, high=1.0)
b2 = np.random.uniform(low=-1.0, high=1.0)
b3 = np.random.uniform(low=-1.0, high=1.0)

for epoch in range(num_epoch):
    # 예측값
    y_hat = w1 * x1 + w2 * x2 + w3 * x3 + b

    error = ((y_hat - y)**2).mean()
    if error < 0.00001:
        break

    # 미분값 적용 (Gradient)
    w1 = w1 - learning_rate * ((y_hat - y) * x1).mean()
    w2 = w2 - learning_rate * ((y_hat - y) * x2).mean()
    w3 = w3 - learning_rate * ((y_hat - y) * x3).mean()

    w1_grad.append(w1)
    w2_grad.append(w2)
    w3_grad.append(w3)

    b = b - learning_rate * (y_hat - y).mean()

    errors.append(error)

    if epoch % 5 == 0:
        print("{0:2} w1 = {1:.5f}, w2 = {2:.5f}, w3 = {3:.5f}, b = {4:.5f} error = {5:.5f}".format(epoch, w1, w2, w3, b, error))

print("----" * 15)
print("{0:2} w1 = {1:.1f}, w2 = {2:.1f}, w3 = {3:.1f}, b = {4:.1f} error = {5:.5f}".format(epoch, w1, w2, w3, b, error))
plt.figure(figsize=(10, 7))

plt.plot(errors)
가중치 (W1, W2, W3) 값들의 변화량 시각화
Epoch가 지남에 따라 어떻게 가중치들이 업데이트 되는지 시각화 해 봅니다.
plt.figure(figsize=(10, 7))

plt.hlines(y=0.3, xmin=0, xmax=len(w1_grad), color='r')
plt.plot(w1_grad, color='g')
plt.ylim(0, 1)
plt.title('W1', fontsize=16)
plt.legend(['W1 Change', 'W1'])
plt.show()
plt.figure(figsize=(10, 7))

plt.hlines(y=0.5, xmin=0, xmax=len(w2_grad), color='r')
plt.plot(w2_grad, color='g')
plt.ylim(0, 1)
plt.title('W2', fontsize=16)
plt.legend(['W2 Change', 'W2'])
plt.show()
plt.figure(figsize=(10, 7))

plt.hlines(y=0.7, xmin=0, xmax=len(w3_grad), color='r')
plt.plot(w3_grad, color='g')
plt.ylim(0, 1)
plt.title('W3', fontsize=16)
plt.legend(['W3 Change', 'W3'])
plt.show()
경사하강법을 활용한 SGDRegressor
from sklearn.linear_model import SGDRegressor
model = SGDRegressor(max_iter=5000, tol=1e-5, learning_rate='constant')
x1 = x1.reshape(-1, 1)
x2 = x2.reshape(-1, 1)
x3 = x3.reshape(-1, 1)
X = np.concatenate([x1, x2, x3], axis=1)
X.shape
model.fit(X, y)
model.coef_
model.intercept_
print("w1 = {:.1f}, w2 = {:.1f}, w3 = {:.1f}, b = {:.1f}".format(model.coef_[0], model.coef_[1], model.coef_[2], model.intercept_[0]))


댓글남기기