🔥알림🔥
① 테디노트 유튜브 -
구경하러 가기!
② LangChain 한국어 튜토리얼
바로가기 👀
③ 랭체인 노트 무료 전자책(wikidocs)
바로가기 🙌
④ RAG 비법노트 LangChain 강의오픈
바로가기 🙌
⑤ 서울대 PyTorch 딥러닝 강의
바로가기 🙌
sklearn 라이브러리를 활용한 mnist 손글씨 10분만에 70,000개 분류하기
sklearn라이브러리(scikit-learn)는 machine learning을 하기 위하여 필요한 막강한 라이브러리입니다.
최근, 딥러닝이 대세가 되면서, pytorch나 tensorflow와 같은 딥러닝을 위한 라이브러리로 관심사가 많이 옮겨간 것은 사실 이지만, linear regression 모델이나 RandomForestClassifier를 활용하면 machine learning을 매우 손 쉽게 적용해 볼 수 있습니다.
실제로, kaggle 경연에서 titanic과 같은 tutorial contest나 bike sharing demand와 같은 입문용 contest는 sklearn 라이브러리만 활용해서도 어느 정도의 performance는 나올 수 있습니다.
sklearn을 활용하여 mnist 손글씨 데이터 분류를 해보고, 정확도 예측까지 해보도록 하겠습니다.
물론, 이 포스팅에서는 StandardScaler를 활용한 Normalization은 다루지 않고, 다른 포스팅에서 다뤄보도록 하겠습니다.
sklearn에서 제공하는 mnist dataset load
sklearn 라이브러리에서 친절하게도 mnist dataset을 제공해 줍니다.
from sklearn.datasets import fetch_openml
mnist = fetch_openml('mnist_784')
mnist.data.shape, mnist.target.shape
# (70000, 784)
Dataset을 train data와 test data로 split하기
dataset을 split 하는 방법은 직접 구현할 수 도 있고 sklearn에서 제공하는 라이브러리를 사용해도 됩니다.
먼저, 구현을 해보자면
split_ratio = 0.9
n_train = int(mnist.data.shape[0] * split_ratio)
print(n_train)
# 63000

n_test = mnist.data.shape[0] - n_train
print(n_test)
#7000

X_train = mnist.data[:n_train]
y_train = mnist.target[:n_train]
print(X_train.shape, y_train.shape)
# ((63000, 784), (63000,))

X_test = mnist.data[n_train:]
y_test = mnist.target[n_train:]
print(X_test.shape, y_test.shape)
# ((7000, 784), (7000,))

# Checking uniqueness of the target
import numpy as np
print(np.unique(y_train))
# array(['0', '1', '2', '3', '4', '5', '6', '7', '8', '9'], dtype=object)
shuffling은 적용하지 않았습니다.
dataset을 shuffling을 하려면 numpy.random.permutation 을 활용하면 손쉽게 dataset을 shuffling 할 수 있습니다.
sklearn 에서 제공하는 train_test_split 모듈을 사용하면 매우 손쉽게 데이터셋을 분류할 수 있습니다.
간단한 예제를 보자면,
import numpy as np
from sklearn.model_selection import train_test_split

# generate samples
sample = np.arange(100)
print(sample)

# array([ 0,  1,  2,  3,  4,  5,  6,  7,  8,  9, 10, 11, 12, 13, 14, 15, 16,
#       17, 18, 19, 20, 21, 22, 23, 24, 25, 26, 27, 28, 29, 30, 31, 32, 33,
#       34, 35, 36, 37, 38, 39, 40, 41, 42, 43, 44, 45, 46, 47, 48, 49, 50,
#       51, 52, 53, 54, 55, 56, 57, 58, 59, 60, 61, 62, 63, 64, 65, 66, 67,
#       68, 69, 70, 71, 72, 73, 74, 75, 76, 77, 78, 79, 80, 81, 82, 83, 84,
#       85, 86, 87, 88, 89, 90, 91, 92, 93, 94, 95, 96, 97, 98, 99])

print(train_test_split(sample))
#[array([46, 66, 42, 54, 58, 90, 11, 93, 28, 97, 17, 31, 55, 27, 74, 25, 91,
#         8, 57,  9, 86, 39, 53, 73, 98, 44, 60, 43, 12, 82, 69,  2, 89, 83,
#        10, 61,  0, 59, 99, 16, 88, 71, 68, 36, 20, 80, 76, 41, 30, 18, 22,
#        75, 34, 50, 79, 37, 78, 52, 32, 14, 63, 92, 87,  5, 21, 24, 38, 72,
#        96, 35, 51, 33, 94,  4, 65]),
# array([84, 26,  6,  1, 62, 81, 15, 19, 29, 23,  7, 56, 77, 45, 49, 95,  3,
#        85, 67, 13, 70, 40, 48, 64, 47])]

X_train, X_test = train_test_split(sample)
print(X_train.shape, X_test.shape)
# ((75,), (25,))
default로 0.75: 0.25 ration로 train 과 test 로 분류해 줍니다.
ratio는 test_size=0.3 와 같은 parameter를 train_test_split 에 지정해 주면 조절할 수 있습니다.
또한 shuffle=False로 지정해 준다면, dataset의 shuffle을 안하도록 할 수도 있습니다.
뭔가 귀찮은 일을 train_test_split 모듈이 다 해주고 있는 느낌이랄까요.
하나만 더 comment를 하자면, randome_state=123 처럼 random state 값을 지정해 주면, 해당 값에 기반하여 random shuffling 됩니다. 즉 123 값을 넘겨 주면, cell을 다시 실행하더라도 똑같이 섞이게 됩니다.
RandomForestClassifier를 활용한 초간단 machine learning
from sklearn.ensemble import RandomForestClassifier

# module loading
clf = RandomForestClassifier()

# train data!
clf.fit(X_train, y_train)

# make predicition
prediction = clf.predict(X_test)
print(prediction.shape)
# 7000

# accuracy
result = (prediction == y_test).mean()
print(result)
# 0.9617142857142857
뭔가 엄청 손쉽게 손글씨를 무려 96.17% 확률로 예측하는 모델을 만들었습니다.
확실히 sklearn은 사용하기 너무 쉽게 잘 만들어 놓았습니다. 몇 가지 parameter의 설정만으로요..
Visualization
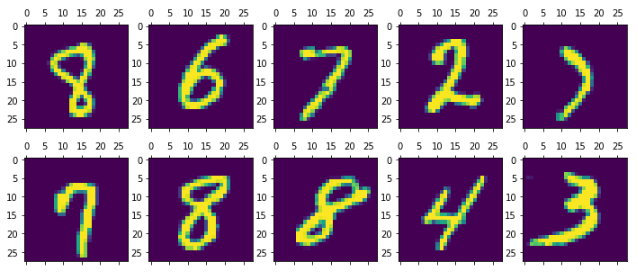
matplotlib을 활용해서 손글씨 분류 예측이 정말 제대로 잘 되었는지 한 번 더 확인해 보겠습니다.
import matplotlib.pyplot as plt
%matplotlib inline

# 랜덤하게 몇 가지 data 가져오기
random_pick = np.random.randint(low=0, high=n_test, size=10)
random_pick
# array([3898, 6815, 6640, 2924,  451, 2688,  633, 6563, 5993, 4024])


figure = plt.figure()
figure.set_size_inches(12, 5)

axes = []
for i in range(1, 11):
    axes.append(figure.add_subplot(2, 5, i))

tmp_list = []
for i in range(10):
    tmp = mnist.data[n_train + random_pick[i]]
    tmp = tmp.reshape(-1, 28)
    tmp_list.append(tmp)

print(y_test[random_pick])

for i in range(10):
    axes[i].matshow(tmp_list[i])
직접 실행해 보시면, 잘 예측하는 것을 눈으로 확인해 보실 수 있습니다.
정확도 96%가 넘기 때문에 틀린 것을 찾기가 더 힘든 수준이네요.
# ['8' '6' '7' '2' '7' '7' '8' '8' '4' '3']

댓글남기기